


Physics Graphs & Statistics
Statistics by Group
Career Related Graphs
Minority Physicists Graphs
Women Physicists Graphs
Top Educators
Terms of Use
APS generates statistical reports on issues in undergraduate physics. These reports are freely available for your use. You may use our graphs in reports and presentations or you may use the raw data to create new graphs and charts. Credit APS and IPEDS as shown on each graph.
Bachelor’s Degrees in Physics and STEM
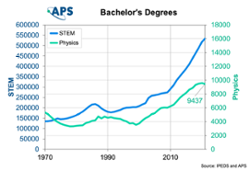
Number of Physics and STEM bachelor's degrees conferred as the first or second major at US institutions

Bachelor’s Degrees in Physics and STEM Earned by Women
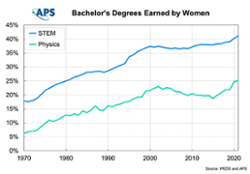
Percent of physics and STEM bachelor's degrees conferred to women as the first or second major at US institutions
Physics Degrees Earned by Women
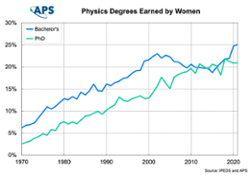
Percent of physics bachelor’s and doctoral degrees earned by women at U.S. institutions
Bachelor’s Degrees Earned by Women, by Major
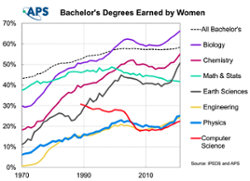
Percent of STEM bachelor’s degrees conferred to women by major (Biology, Chemistry, Math & Statistics, Earth Sciences, Physics, and Engineering)
Doctoral Degrees Earned by Women, by Major
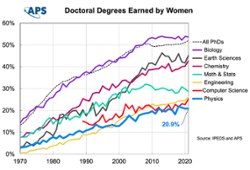
Percent of STEM doctoral degrees conferred to women by major (Biology, Chemistry, Math & Statistics, Earth Sciences, Physics, and Engineering)
Degrees Earned by Women, by Field
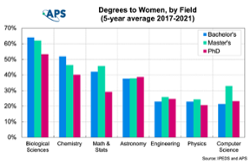
Average percent of bachelor’s, master’s, and doctoral degrees earned by women by major (Biology, Chemistry, Math & Statistics, Earth Sciences, Physics, and Engineering)
Doctoral Degrees Earned by Women, by Citizenship
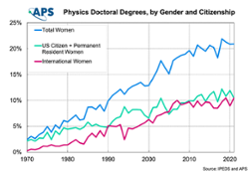
Percent of doctoral degrees earned by women, by US residency status
Bachelor’s Degrees Earned by African Americans, by Major
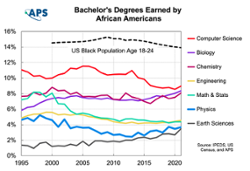
Percent of STEM bachelor’s degrees conferred to Black or African American students, by major (Biology, Chemistry, Math & Statistics, Earth Sciences, Physics, and Engineering)
Bachelor’s Degrees Earned by Hispanic Americans, by Major
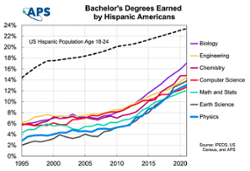
Percent of STEM bachelor’s degrees conferred to Latino or Hispanic students, by major (Biology, Chemistry, Math & Statistics, Earth Sciences, Physics, and Engineering)
Physics Degrees Earned by Individuals Marginalized by Race/Ethnicity
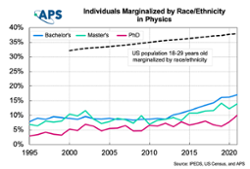
Percent of bachelor’s, master's, and doctoral degrees awarded to individuals marginalized by race/ethnicity in physics, normalized to population of college-age individuals marginalized by race/ethnicity in the United States
Degrees Awarded to Individuals Marginalized by Race/Ethnicity, by Field

Average percent of bachelor’s, master’s, and doctoral degrees awarded to individuals marginalized by race/ethnicity, by major (Biology, Chemistry, Math & Statistics, Earth Sciences, Physics, and Engineering)
Retention of Individuals Marginalized by Race/Ethnicity in Physics
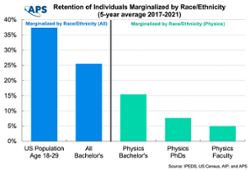
Percentage of individuals marginalized by race/ethnicity in physics compared to the percentage of marginalized by race/ethnicity in the US college age resident population
Bachelor’s Degrees by Gender and Race/Ethnicity
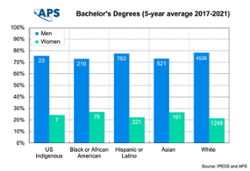
Average percent of bachelor’s degrees granted to men and women for various races and ethnicities
Physics Degrees by Race/Ethnicity
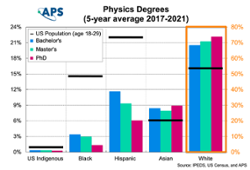
Percentage of physics bachelor’s and doctoral degrees awarded to people of various races and ethnicities
Physics Bachelor’s Degrees Awarded to African Americans at HBCUs
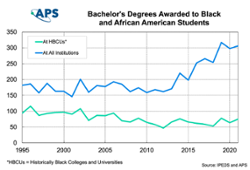
The number of physics bachelor's degrees awarded to African Americans at Historically Black Colleges and Universities (HBCUs).
Physics Degrees Earned by Temporary Residents
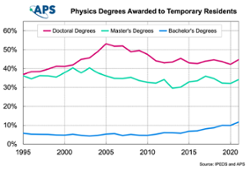
Physics Degrees Earned by Temporary Residents (physics bachelor's, master’s, and doctoral degrees awarded to temporary residents)
Physics Doctoral Degrees by Citizenship
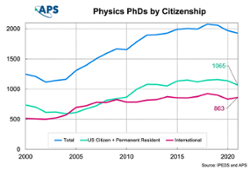
Number of physics PhDs awarded to US and foreign citizens
High School Teachers with a Physics Degree

Percentage of teachers with degrees in their respective teaching fields (Social Studies, English, Biology, Math, Physics, Chemistry)
Students Taking High School Physics
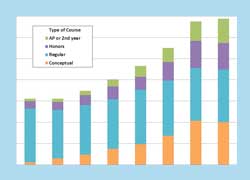
Student enrollment for various physics high school courses
Information for
About APS
The American Physical Society (APS) is a nonprofit membership organization working to advance the knowledge of physics.
© 2024 American Physical Society | Privacy Policy | Contact Us
1 Physics Ellipse, College Park, MD 20740-3844 | (301) 209-3200